Kindling Lane: new flavor pricing
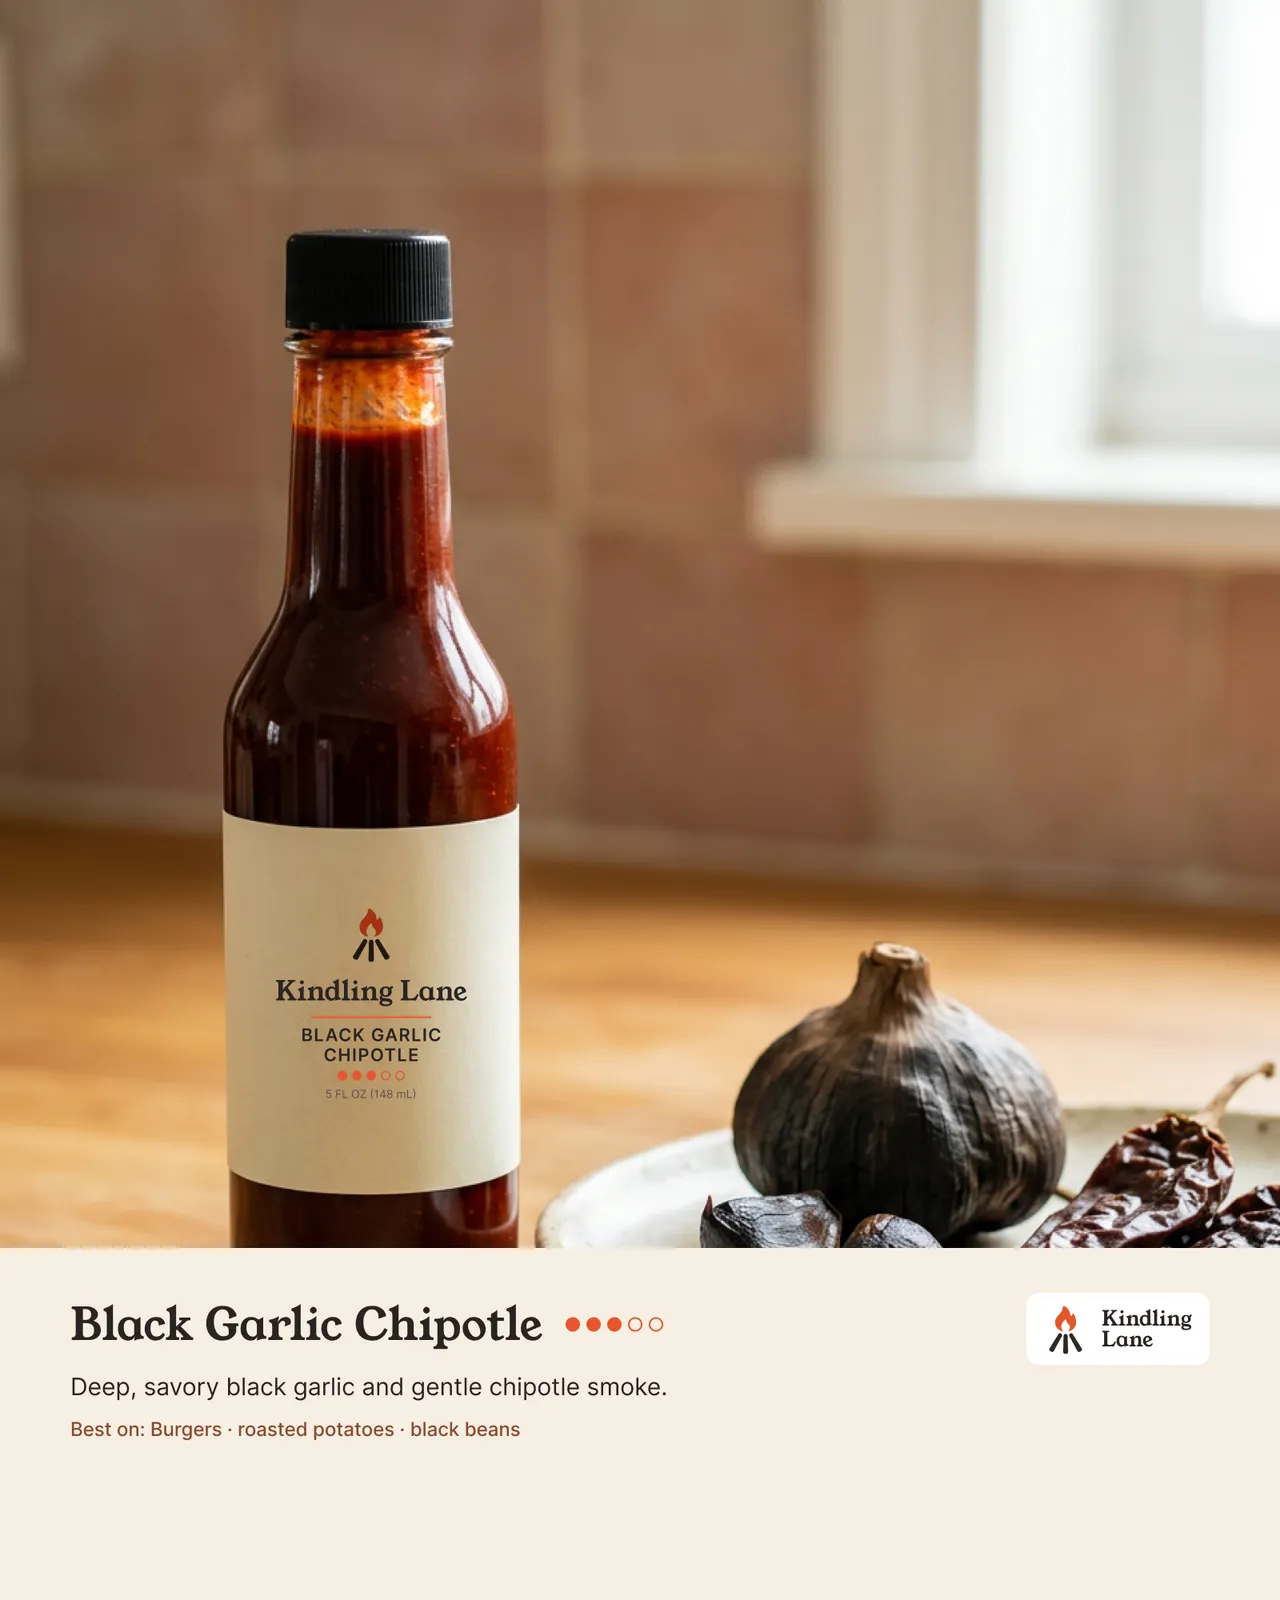
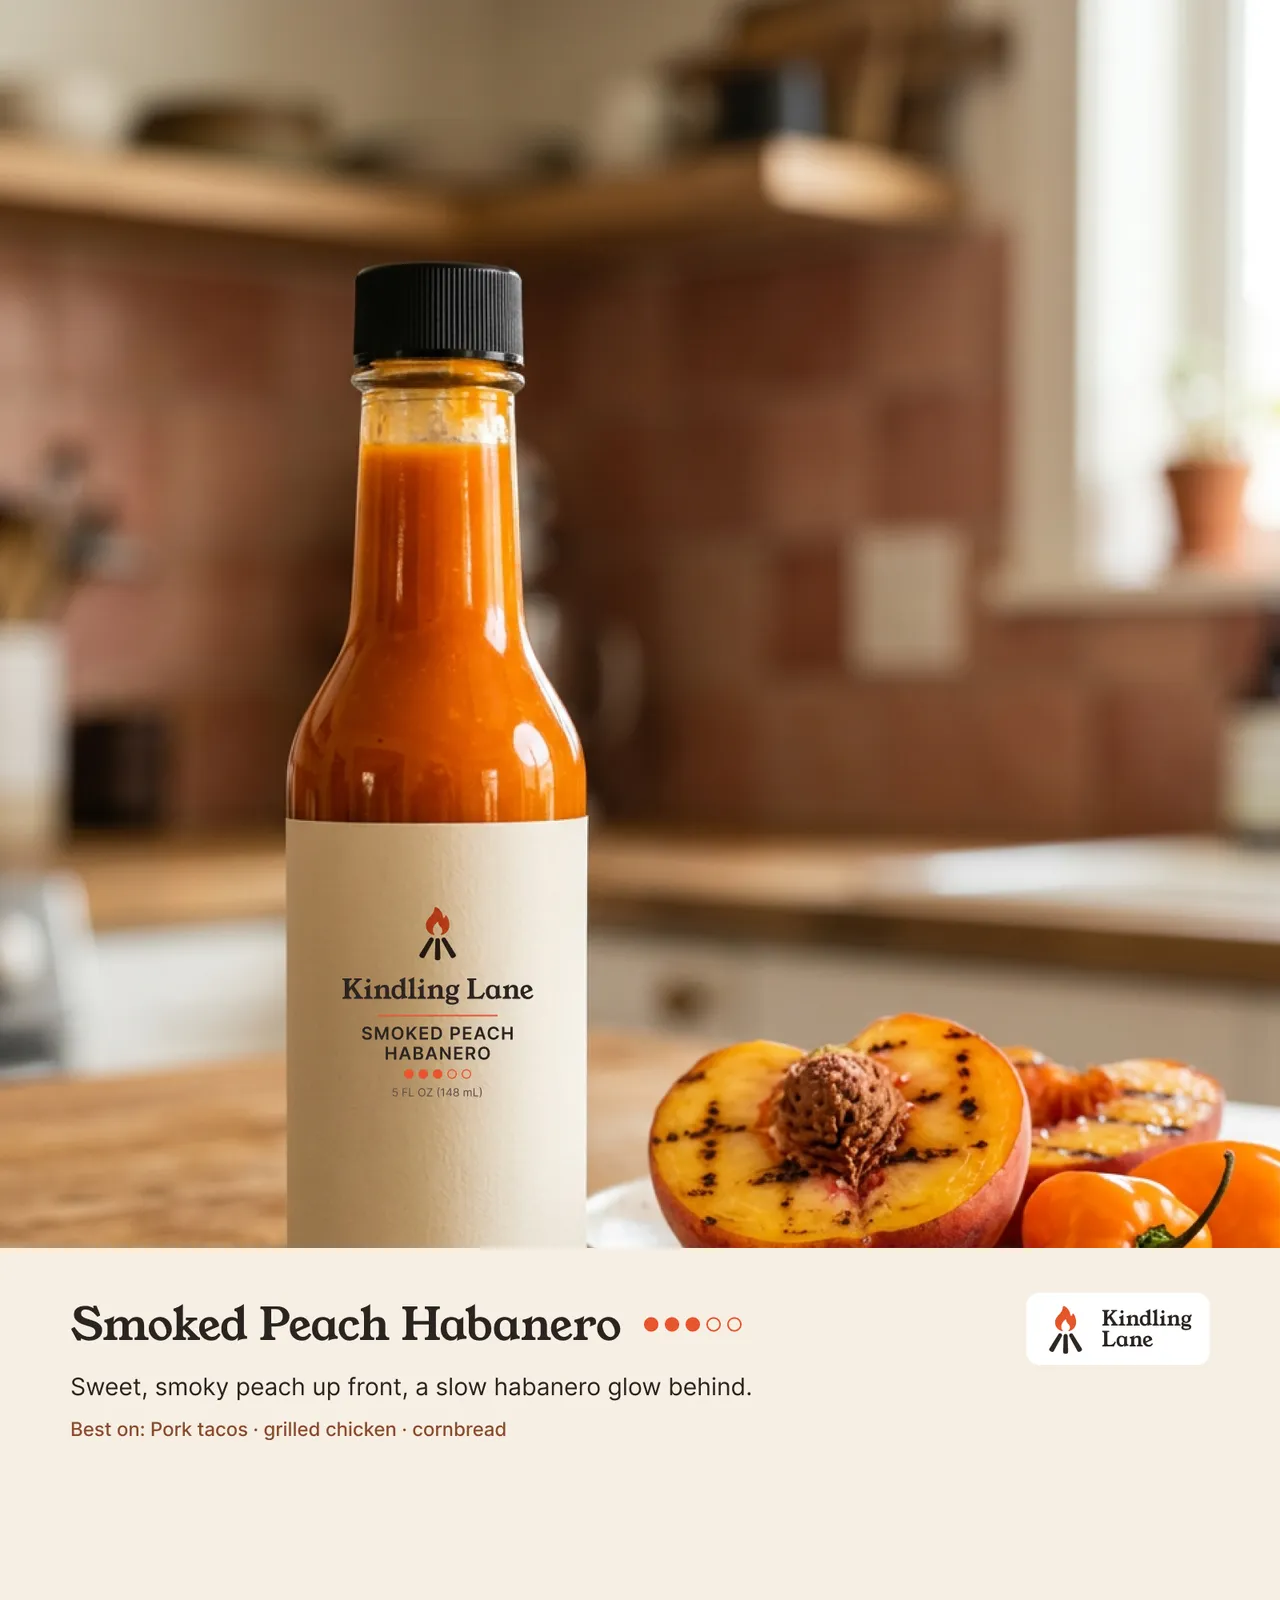
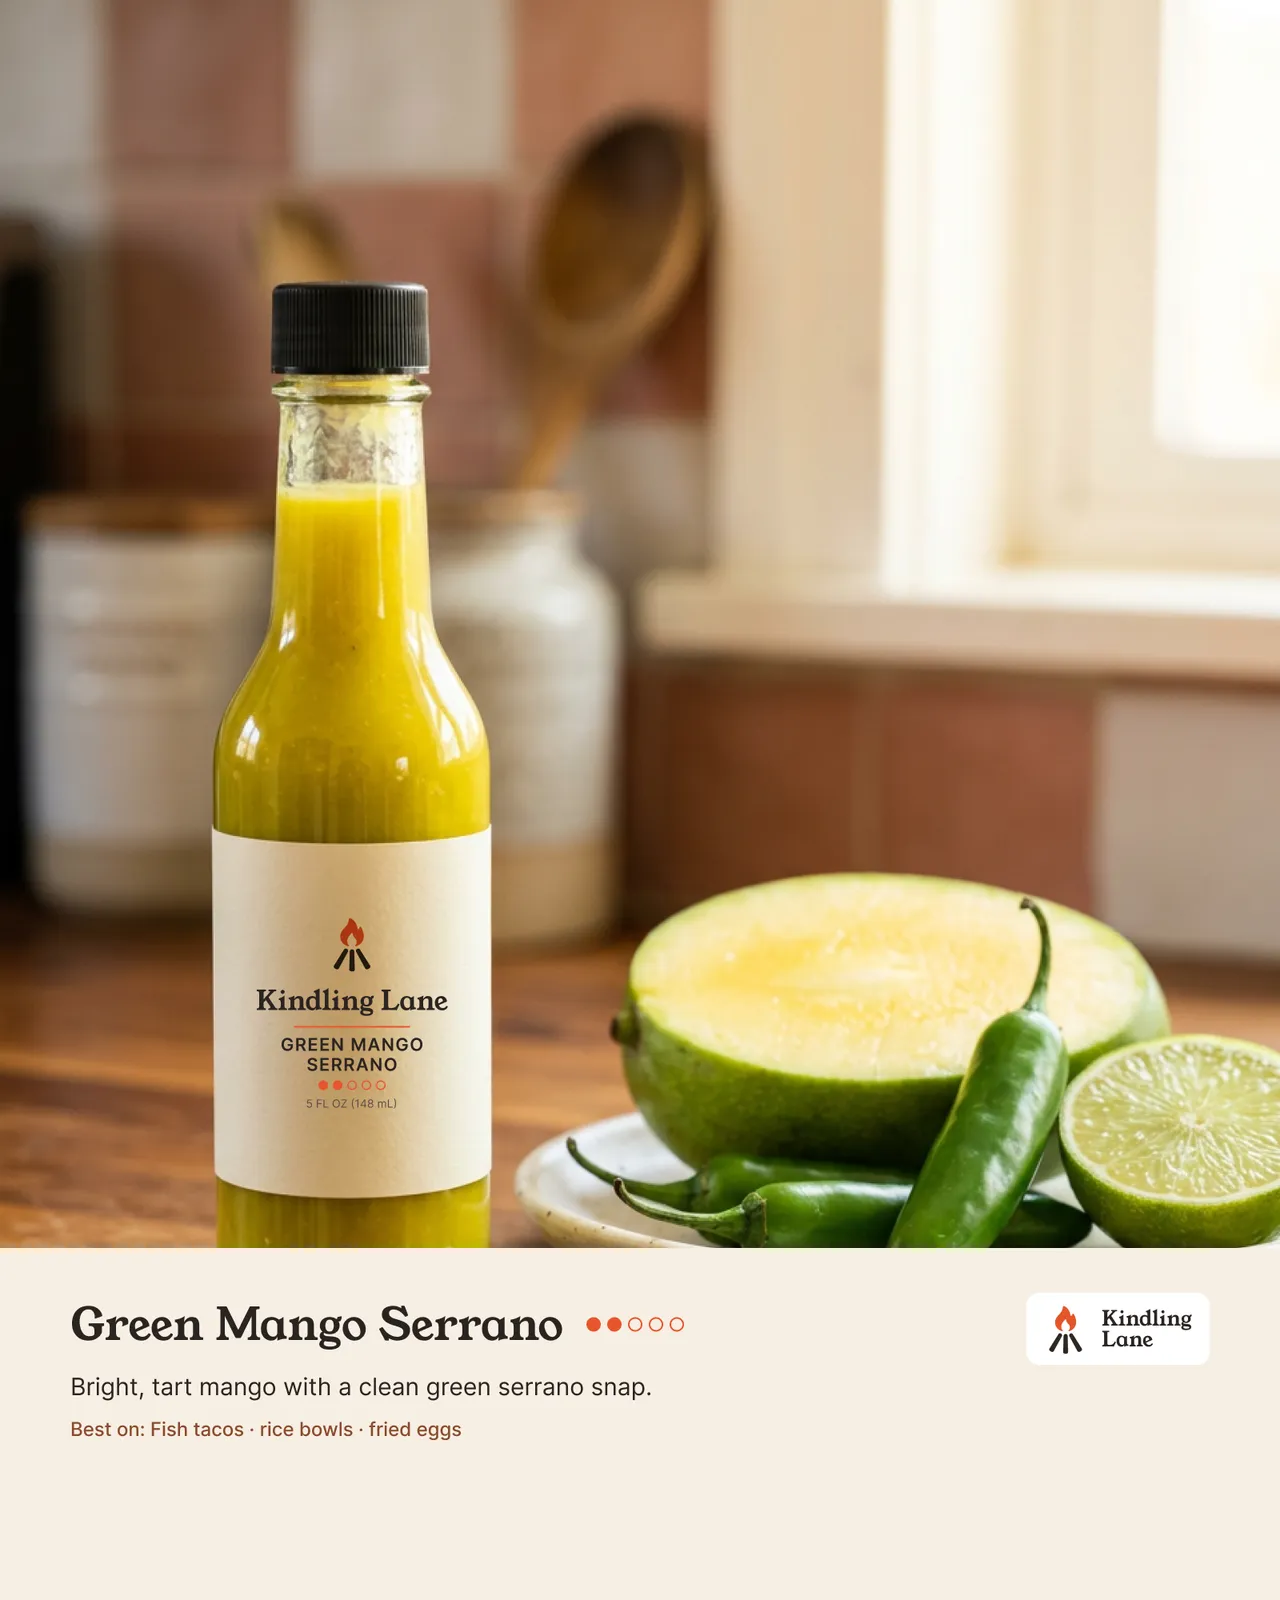
| Effectiveness score | Feeling | Feeling intensity | Something new | Relevance | Brand appeal | Would use more | Brand recall | |
|---|---|---|---|---|---|---|---|---|
| 74.2Strong | 76.8 | 77.5 | 68.5 | 72.6 | 73.0 | 76.4 | 74.5 | |
| 68.9Strong | 68.9 | 68.6 | 70.7 | 69.1 | 67.9 | 68.3 | 69.1 | |
| 65.2Middling | 62.6 | 62.4 | 76.5 | 65.1 | 60.7 | 64.8 | 64.1 |
From what people say they’d pay: a range to start from, not a price tag.
$10
| Acceptable prices | Balance point | Best-revenue price | Premium over the others | What likely users would pay | At $10 | |
|---|---|---|---|---|---|---|
| $7.50 – $23192 respondents | $12.99indifference $14.99 | $11.9984% said they’d pay it | +18%more | $20vs $14 from the rest | 92% would pay · 1% call it prohibitive | |
| $6.50 – $19.99197 respondents | $10.99indifference $12.99 | $1272% said they’d pay it | +0%about the same | $16vs $12.50 from the rest | 84% would pay · 2% call it prohibitive | |
| $5 – $15.99194 respondents | $8.50indifference $9.99 | $9.9966% said they’d pay it | −21%less | $14vs $10 from the rest | 65% would pay · 10% call it prohibitive |
Would they buy at your prices?
Each respondent was asked about two of these prices for each piece of content, picked at random. “Would buy” counts Definitely and Probably; people say yes more readily than they buy, so the definitely share is the safer read. In bold, each piece of content’s best-revenue price: the price where price × the would-buy share is highest.
| $8, one-time | $10, one-time | $12, one-time | $14, one-time | $16, one-time | |
|---|---|---|---|---|---|
| 94%66% definitely · 90 | 83%39% definitely · 83 | 72%46% definitely · 87 | 64%23% definitely · 74 | 47%26% definitely · 66 | |
| 87%51% definitely · 83 | 78%39% definitely · 87 | 52%26% definitely · 77 | 41%24% definitely · 82 | 35%8% definitely · 71 | |
| 70%40% definitely · 67 | 51%24% definitely · 88 | 34%12% definitely · 82 | 26%9% definitely · 81 | 28%13% definitely · 82 |
What each group of payers favored
Do people who said they’d pay more rank a different piece of content first?
Not clearly. No piece of content is clearly favored more by high payers or by low payers: too close to call with 200 respondents.
Respondents in thirds by how much they said they’d pay at most, compared with what others said for the same piece of content. Each row is the share of each third who ranked it first.
From what people say they’d pay at most: a range to start from, not a price tag.