Wayloft: travel pack add-ons
160 / 160 completed
Your strongest ideas
Detachable Sling is the clear winner on price range.
What’s worth paying for
Leaders: “Lifetime Repair”, “Packing Cube Set” and “Detachable Sling”. Possible killers: “Moss Colorway”. Table stakes: “A padded laptop sleeve that zips into the back panel, with its own grab handle.”.
| Worth paying for−100 leastaveragemost +100 | Puts off | Would miss | ||
|---|---|---|---|---|
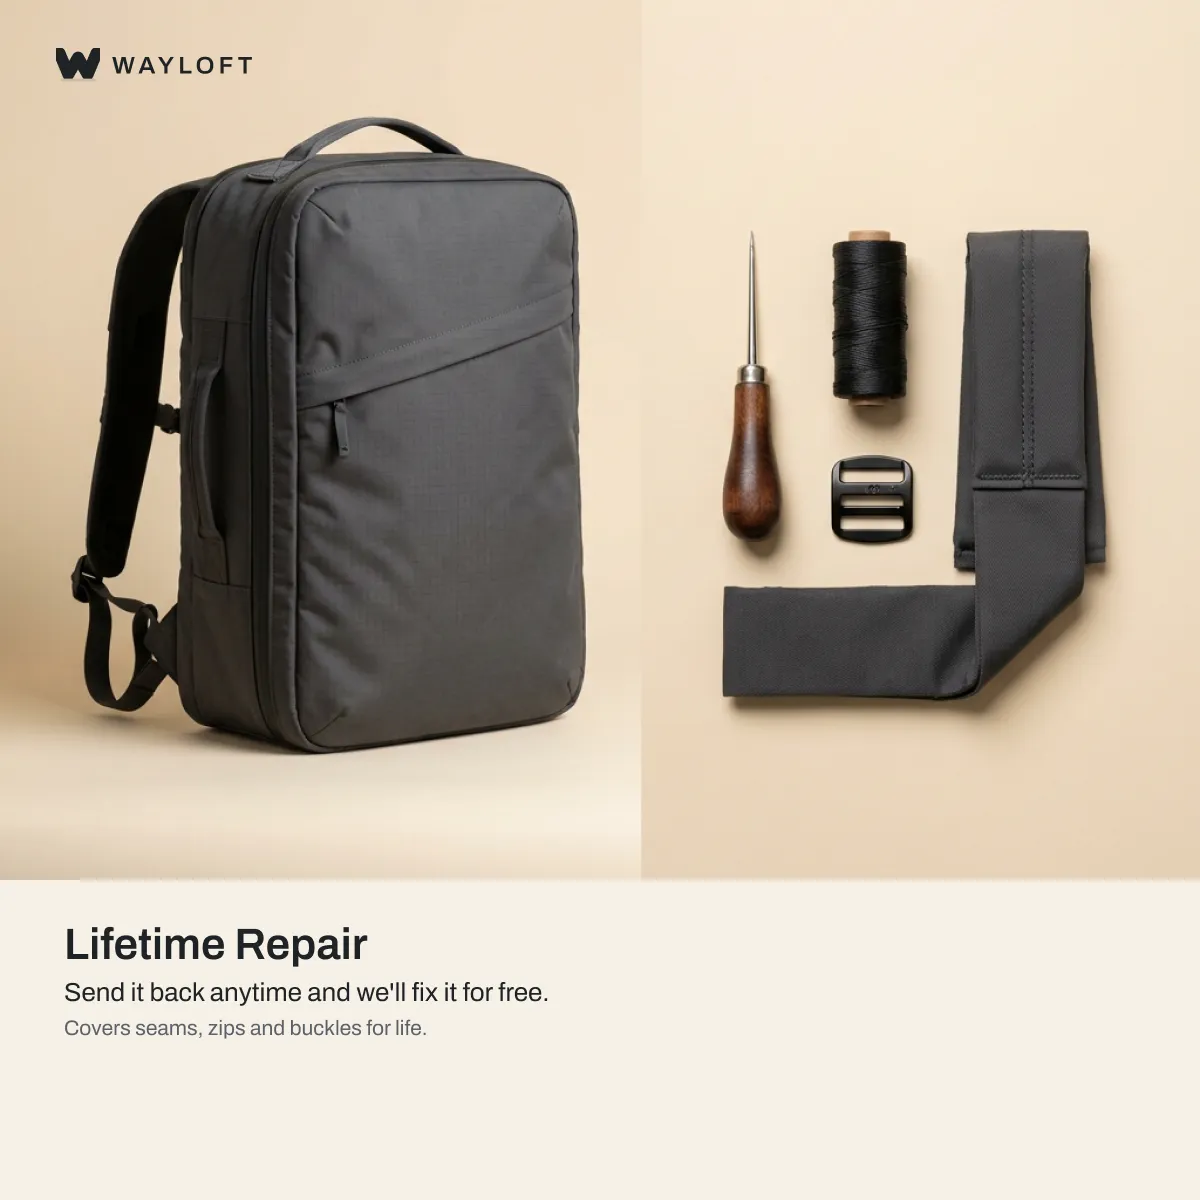 | Leader | +56 | 0% | 44% |
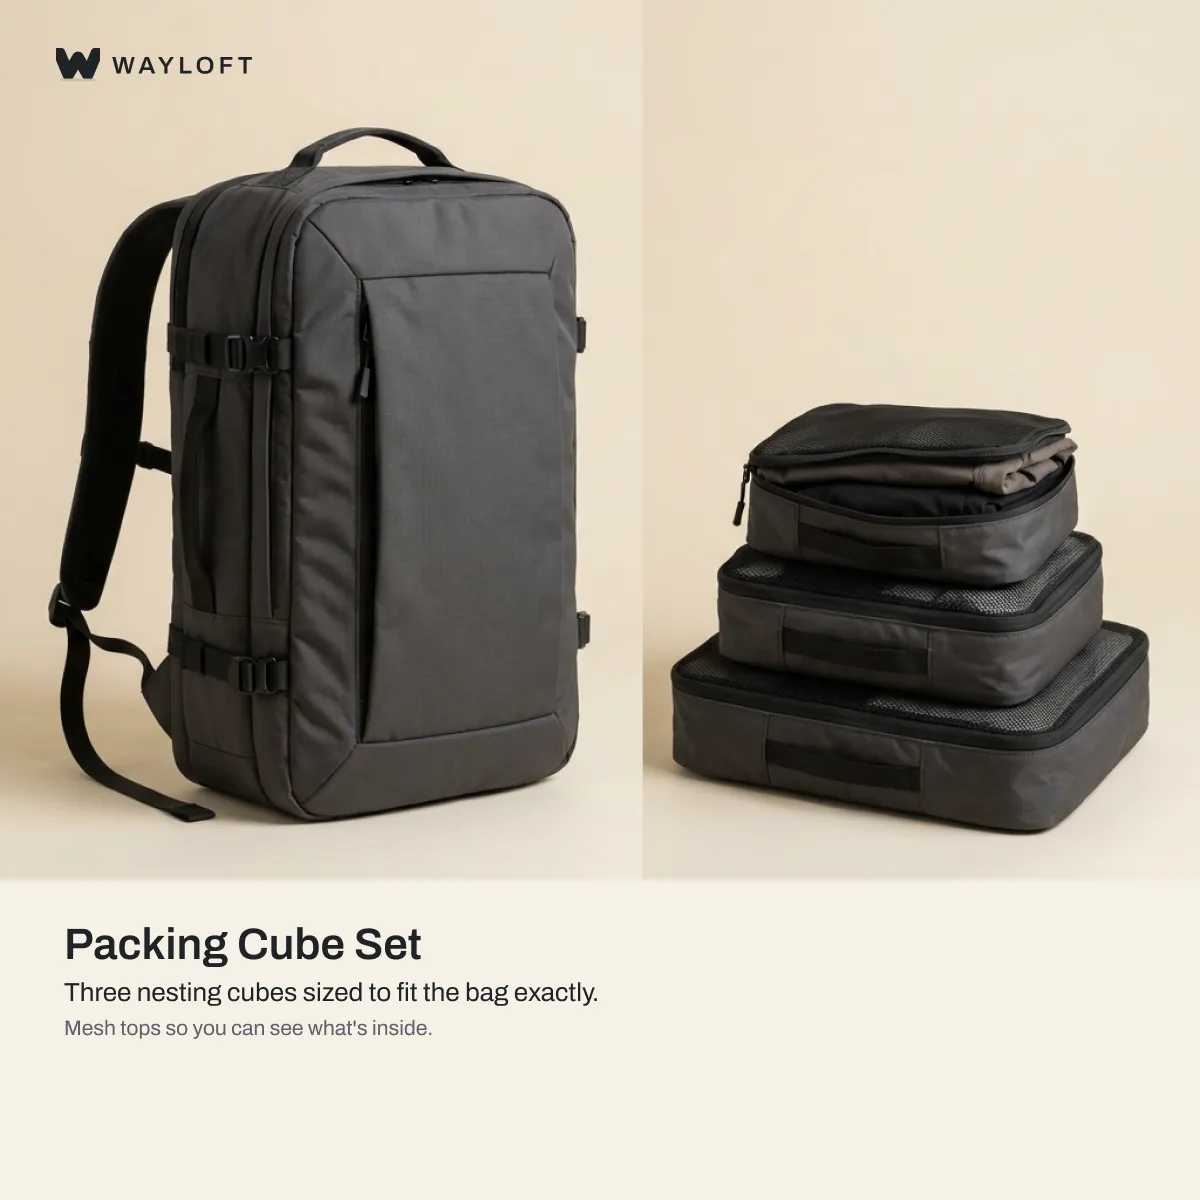 | Leader | +30 | 2% | 18% |
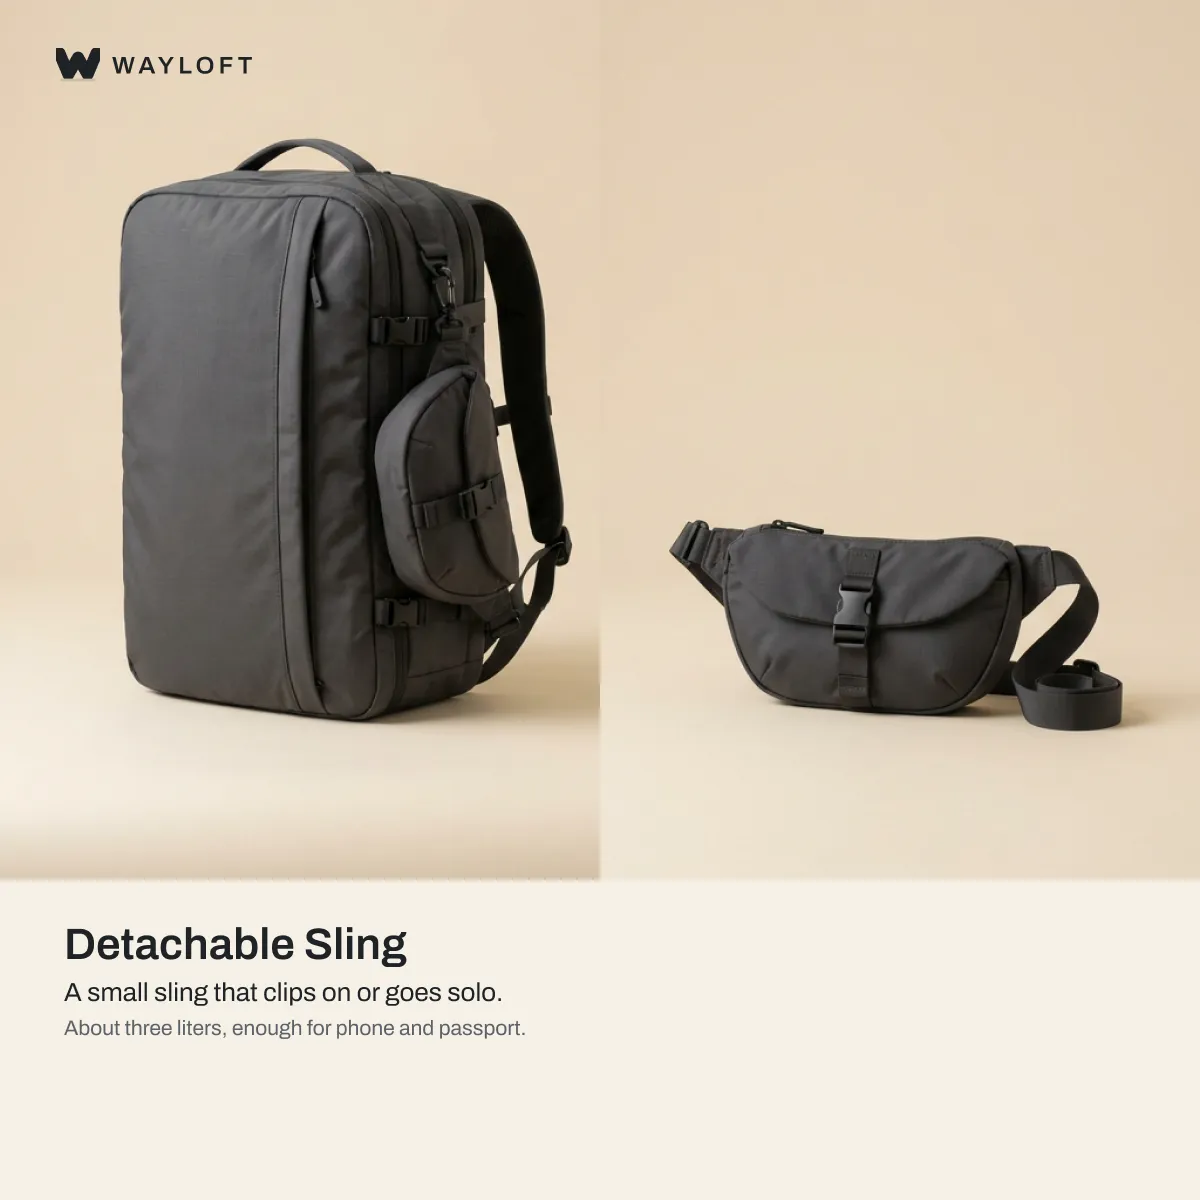 | Leader | +10 | 4% | 13% |
| Table stakes | 0 | 2% | 68% | |
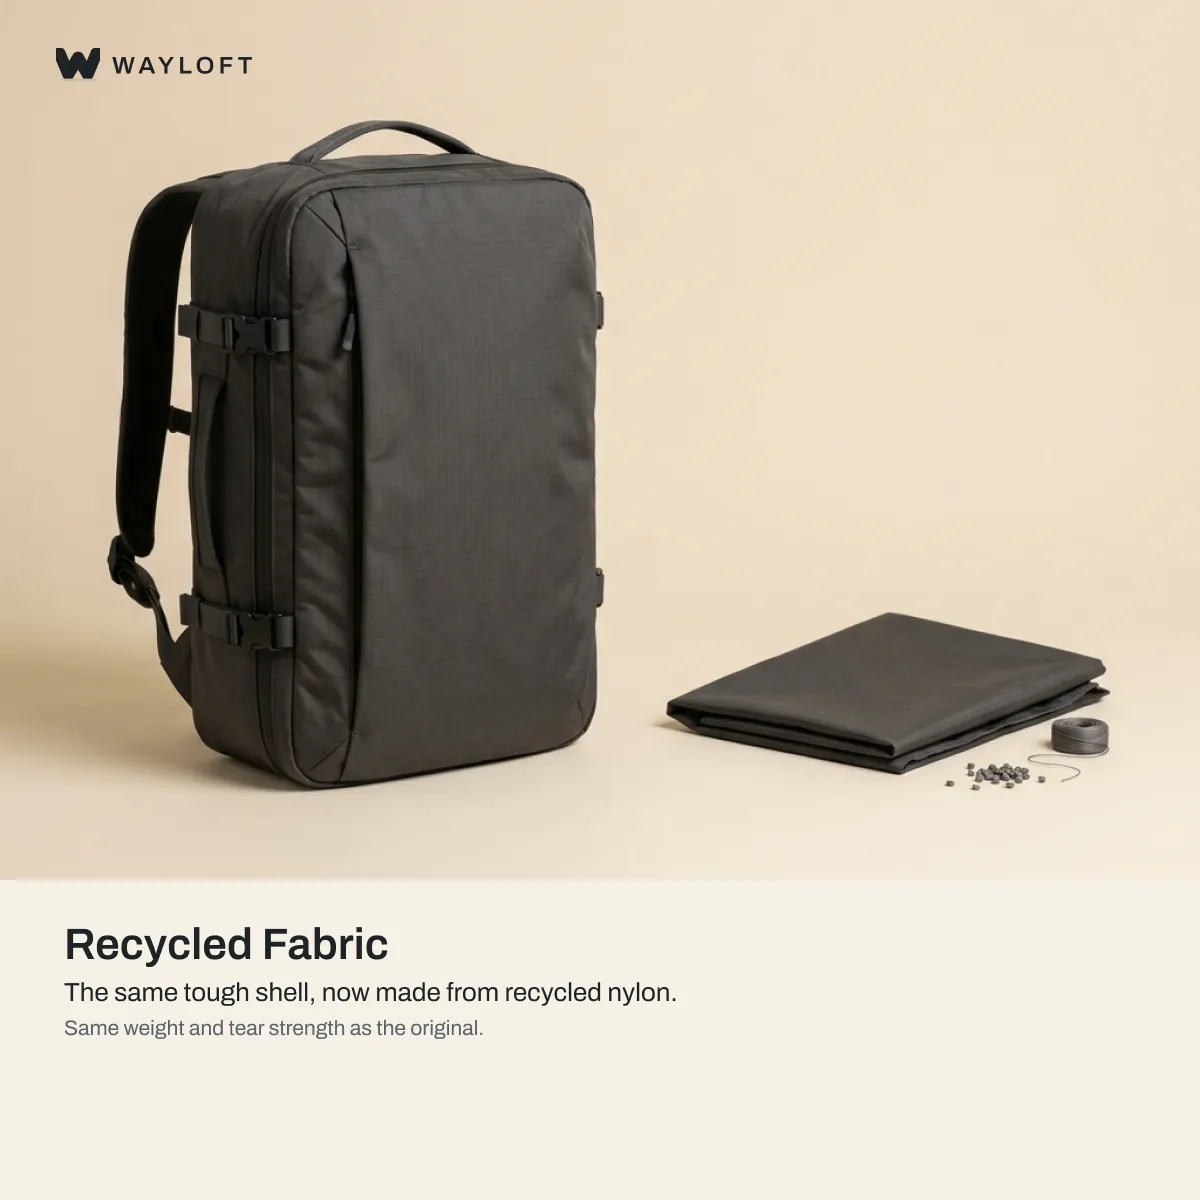 | Filler | -21 | 6% | 16% |
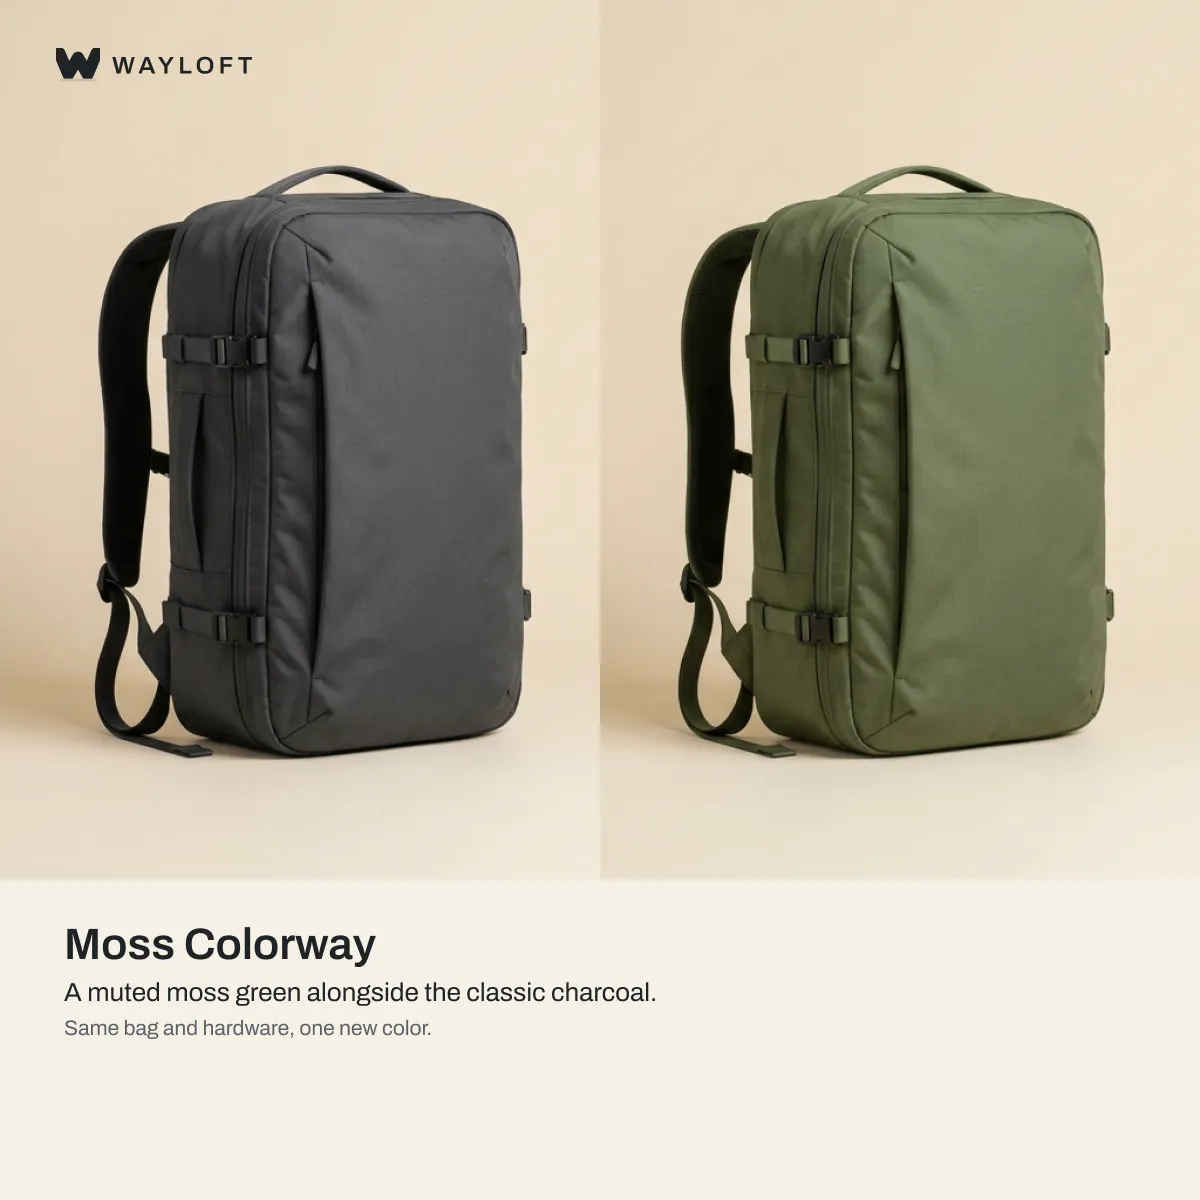 | Possible killer | -72 | 23% | 16% |
Leaders are clearly more worth paying for than the average option. Fillers aren’t clearly above it. Killers put off 20% or more, clearly, whatever their score; a possible killer is at 20% but not clearly yet. Table stakes aren’t leaders or killers, but 50% or more would be disappointed not to get them, and clearly more than 40%: people expect them; a possible table stakes is at 50% but not clearly yet. The scores compare these options with each other, from what people say: a ranking to build and price from, not prices.
What they’d pay, one-time
Detachable Sling drew the highest typical price people would accept, $32, one-time; Moss Colorway the lowest, $7.
From what people say they’d pay: a range to start from, not a price tag.
Type a price to see, for each concept, the share who’d pay it and the share who call it prohibitive. It starts at the typical price people would accept and is drawn dashed across the chart.
$0$50$100$150
Price check
$20
$20
$32willing
$49max
$85prohibitive
$26willing
$39.50max
$70prohibitive
$24willing
$35max
$60prohibitive
$23willing
$34.50max
$61prohibitive
$12willing
$18.49max
$31prohibitive
$7willing
$10max
$18prohibitive
| Acceptable prices | Balance point | Best-revenue price | Premium over the others | What likely users would pay | At $20 | |
|---|---|---|---|---|---|---|
| $19.99 – $63156 respondents | $29.50indifference $38.99 | $4065% said they’d pay it | +55%more | —0 likely users | 98% would pay · 0% call it prohibitive | |
| $16.99 – $51156 respondents | $23.99indifference $33 | $3078% said they’d pay it | +28%more | —0 likely users | 97% would pay · 1% call it prohibitive | |
| $14.99 – $46153 respondents | $17.99indifference $29 | $26.9975% said they’d pay it | +12%more | —0 likely users | 88% would pay · 2% call it prohibitive | |
| $13.99 – $44158 respondents | $19.50indifference $28.99 | $28.9966% said they’d pay it | +5%more | —0 likely users | 85% would pay · 1% call it prohibitive | |
| $7.50 – $23.99154 respondents | $11.99indifference $15 | $12.9981% said they’d pay it | −45%less | —0 likely users | 42% would pay · 16% call it prohibitive | |
| $4.50 – $13153 respondents | $6.50indifference $8.50 | $6.9986% said they’d pay it | −68%less | —0 likely users | 10% would pay · 62% call it prohibitive |